Project: Interactive Super Store Executive Dashboard
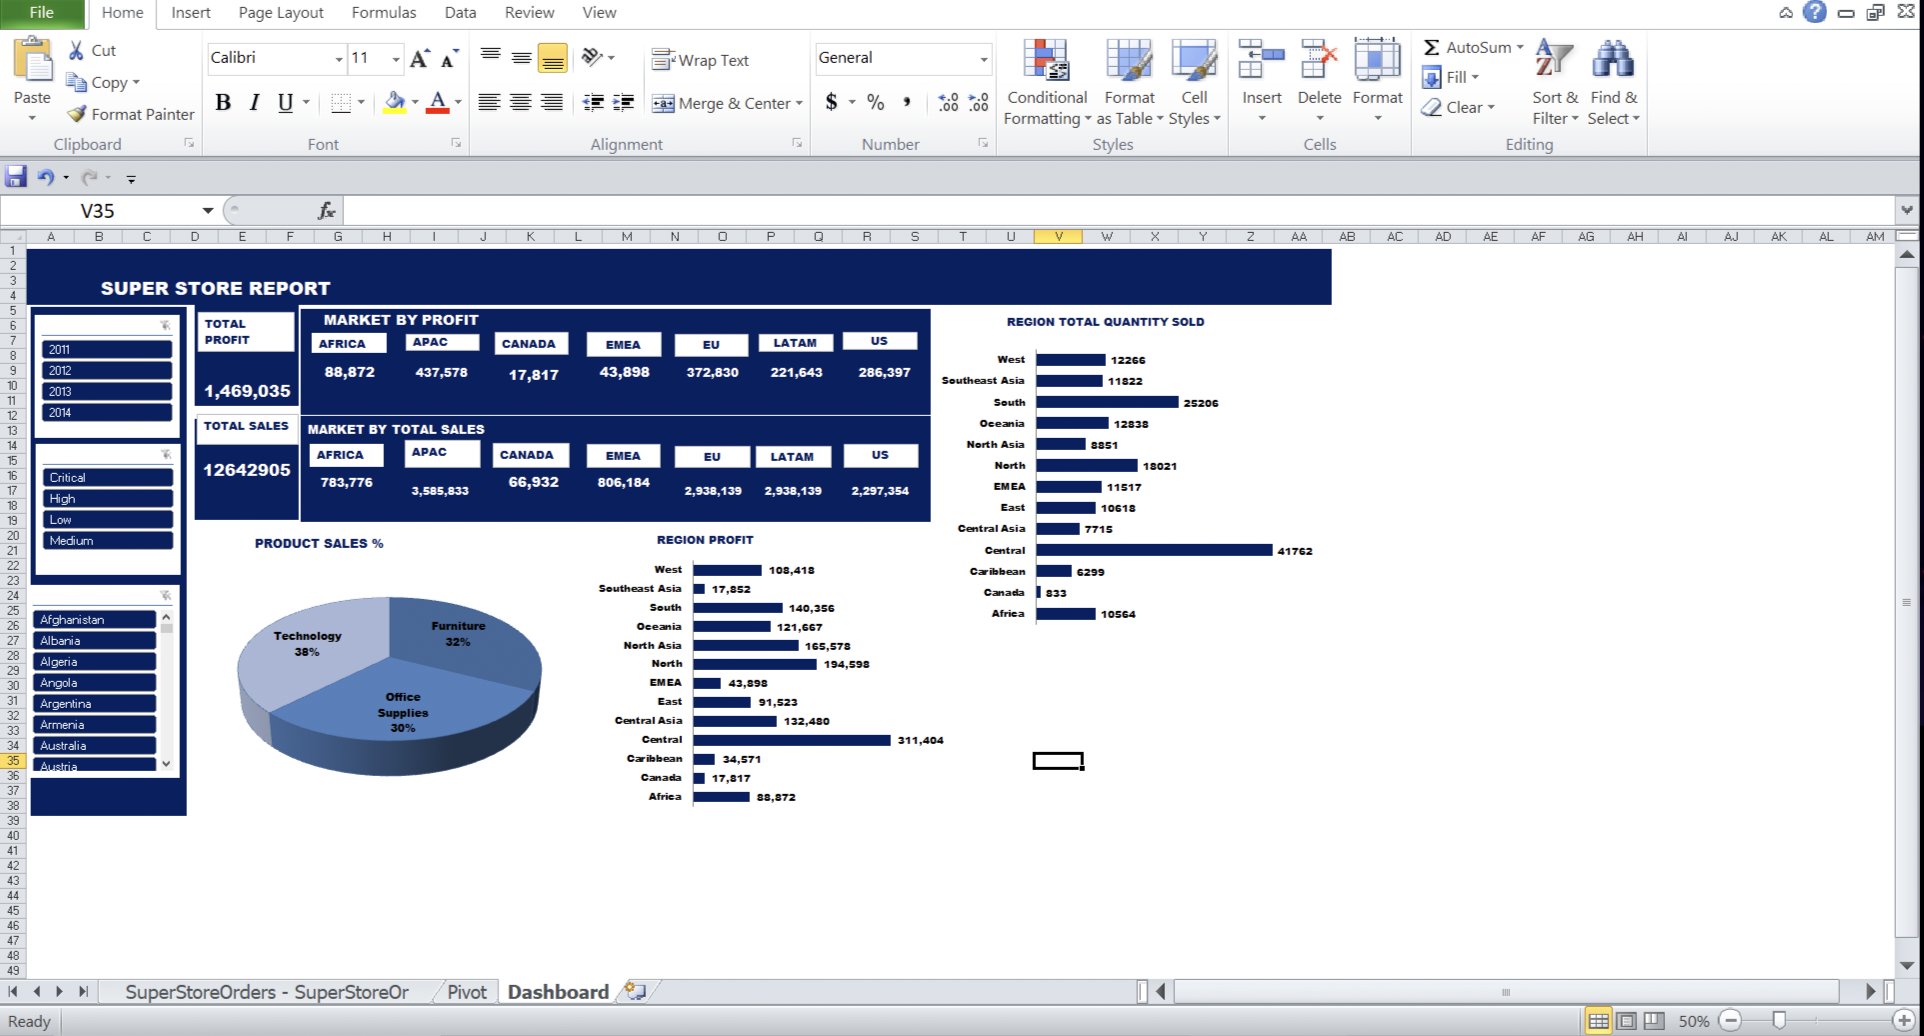
Developed a dynamic, multi-market retail performance dashboard in Microsoft Excel utilizing Power Query for data extraction, cleaning, and modeling.
Formulated structured KPI summary blocks to track $12.6M+ in total sales and $1.4M+ in profits across 7 global market territories.
Implemented an intuitive UI sidebar layout featuring synchronized multi-slicer filtering (Timeline, Order Priority, Country) to allow stakeholders to drill down into localized data instantaneously.
Designed clean, professional visualizations (horizontal bar charts, optimized category breakdowns) ensuring clutter-free data readability and rapid insights generation.
Multi-Category Family Financial Spending Analysis
Summary
The Objective: Built a comprehensive financial tracking and reporting model to analyze expenditure behaviors across multiple household categories, providing deep insights into cost distribution.
Tools Used: Microsoft Excel, Advanced Lookup Arrays (VLOOKUP, INDEX/MATCH), Descriptive Statistics, Interactive Pivot Tables.
Key Responsibilities & Implementation:
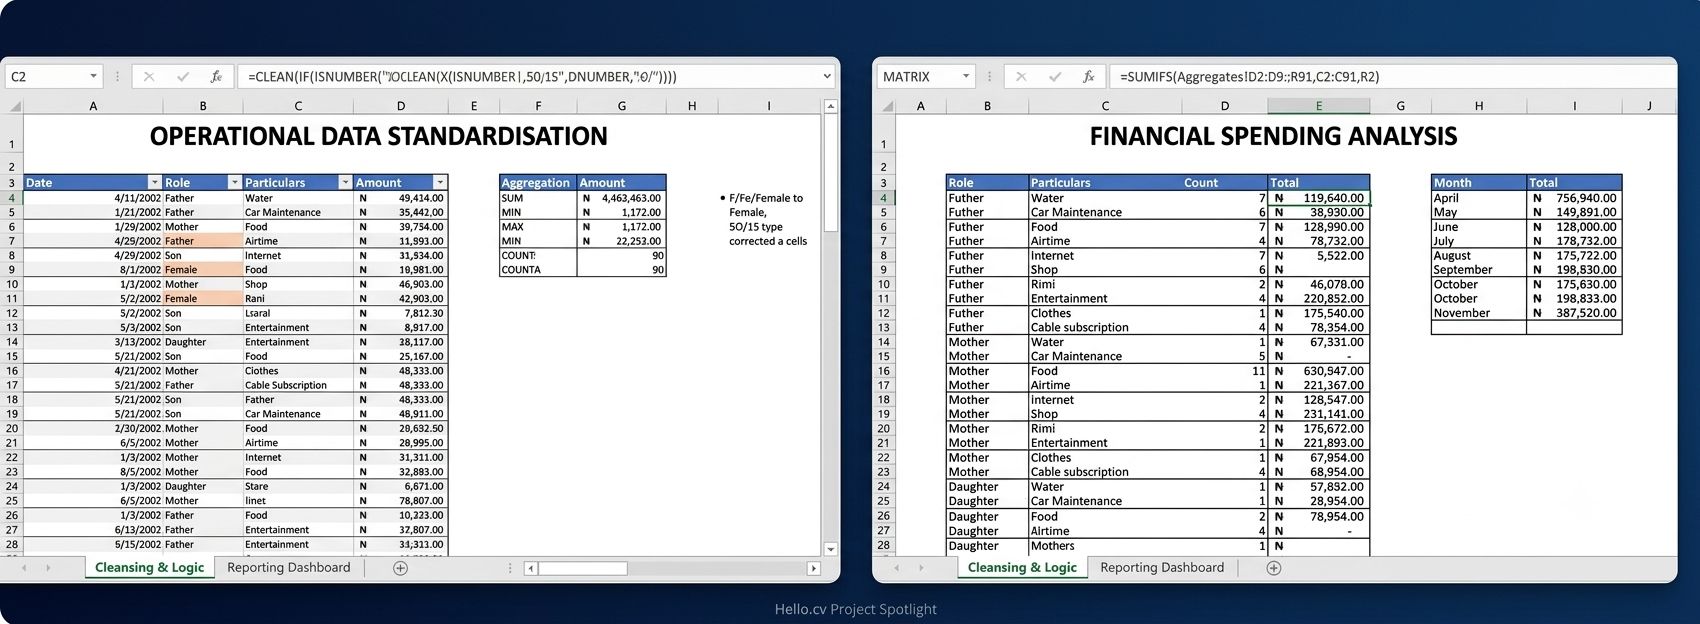
Descriptive Statistical Modeling: Utilized statistical aggregations (COUNT, COUNTA, MAX, MIN, AVERAGE) to establish spending baselines, track transaction frequency, and isolate peak expenditure anomalies.
Multi-Dimensional Data Retrieval: Engineered robust lookup frameworks using VLOOKUP to seamlessly extract specific item expenditures across family units.
Matrix Intersection & Extraction: Deployed a dynamic 2D grid intersection model using INDEX and MATCH combined, bypassing traditional lookup limitations to pinpoint exact individual spend metrics across granular expense categories.
Aggregated Business Intelligence: Summarized thousands of data points into a polished, high-level Pivot Table report to instantly visualize overall spending trends and departmental distributions.
The Deliverable:
Created an interactive, tabular financial intelligence dashboard that enables stakeholders to immediately identify top spending drivers, track averages, and audit individual cost centers in a single view.
Human Resources Dashboard in Microsoft Excel
Summary
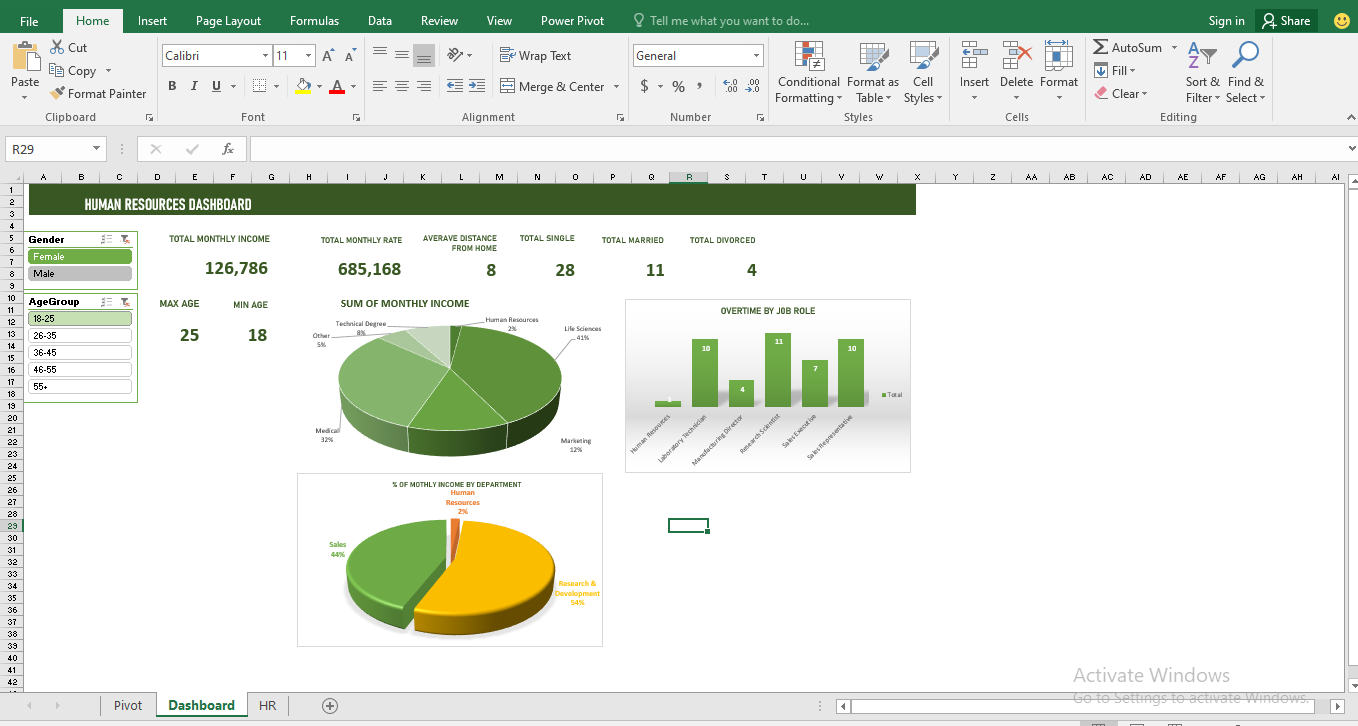
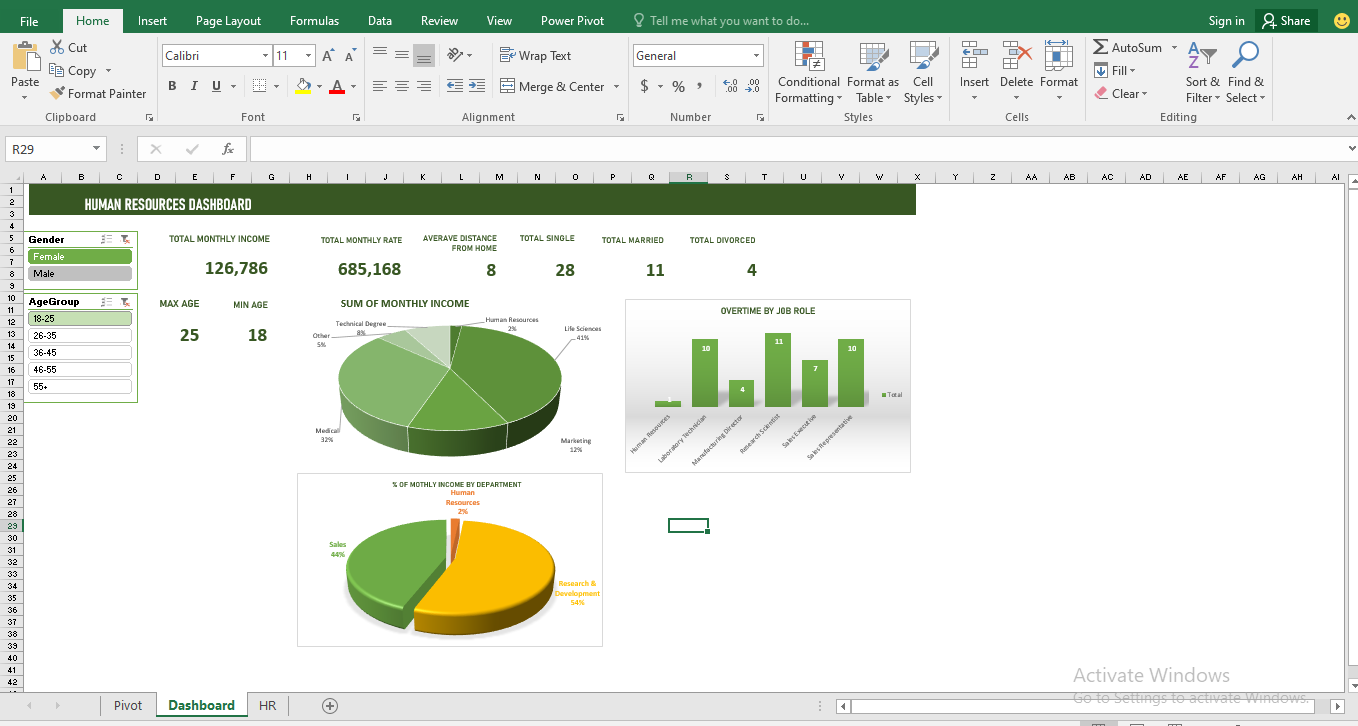
I recently built this HR Dashboard to practice turning raw employee data into actionable business insights. By focusing on workforce demographics and compensation, this tool allows HR teams to quickly spot trends in retention, departmental costs, and overtime distributions.
Key Features:
🔹 Dynamic Filtering: Leveraged Slicers (Gender & Age Group) for interactive, real-time data exploration.
🔹 KPI Tracking: Built high-level metrics for quick snapshots of monthly spend, average commute distance, and marital status distributions.
🔹 Data Visualization: Structured breakdown of income allocation across departments and job roles to help optimize budget planning.
Always looking to improve—analytics peers, I'd love to hear your feedback on the layout and presentation!
Nigeria Agricultural Data Intelligence Platform
→
Summary
3MTT Capstone: Nigeria Agricultural Data Intelligence Platform
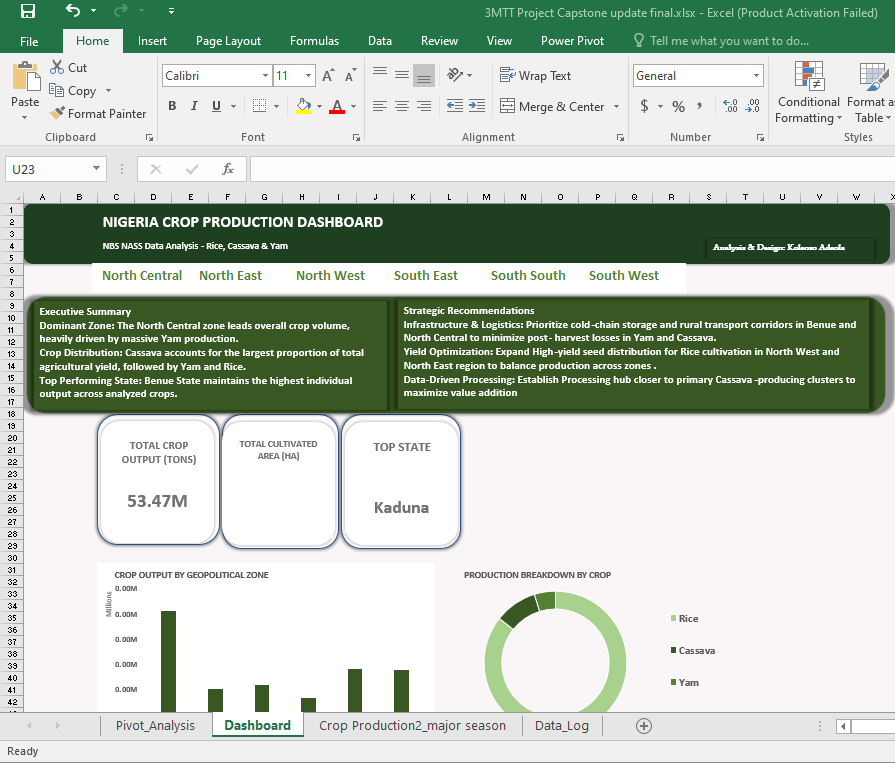
Built an end-to-end data pipeline and 16:9 interactive Excel dashboard analyzing crop production trends (Rice, Yam, Cassava) across Nigeria's 36 states using National Bureau of Statistics (NBS) data. Features automated ETL workflows, dynamic regional slicers, and strategic policy recommendations for top agricultural hubs.
The Objective
Built and executed a series of advanced relational database queries on an e-commerce transactional dataset (AdventureWorks) to isolate revenue trends, track critical inventory gaps, and evaluate consumer purchase correlations for business intelligence optimization.
Tools Used
Microsoft SQL Server, T-SQL, Relational Database Architecture, Subqueries & Aggregations.
Key Responsibilities & Implementation
Revenue Attribution Modeling: Engineered advanced table joins across sales, product, and territory structures to aggregate lifetime revenue contributions and calculate exact cost/acquisition margins for specific retail lines.
Inventory Gap Identification: Constructed specialized LEFT JOIN isolation queries to audit the product catalog and identify specific dead-stock items that have never recorded a historical order.
Conditional Data Segmentation: Utilized CASE statements to structurally categorize transaction items based on physical shipping weights, successfully establishing correlation metrics between order quantities and package classes (Light, Medium, Heavy).
Consumer Behavioral Diagnostics: Designed complex self-joins and subqueries to uncover purchase patterns, isolating items frequently bought together in a single transaction to drive strategic cross-selling insights.
Performance Baseline Tracking: Calculated transactional metrics (such as TrueAverageOrder value) across millions of historical points by decoupling grouped order details via independent subquery expressions.
The Deliverable
Delivered a highly optimized script of analytical T-SQL queries capable of parsing massive transaction logs into isolated, strategic business metrics—bridging the gap between raw backend database states and actionable sales intelligence.
Description:
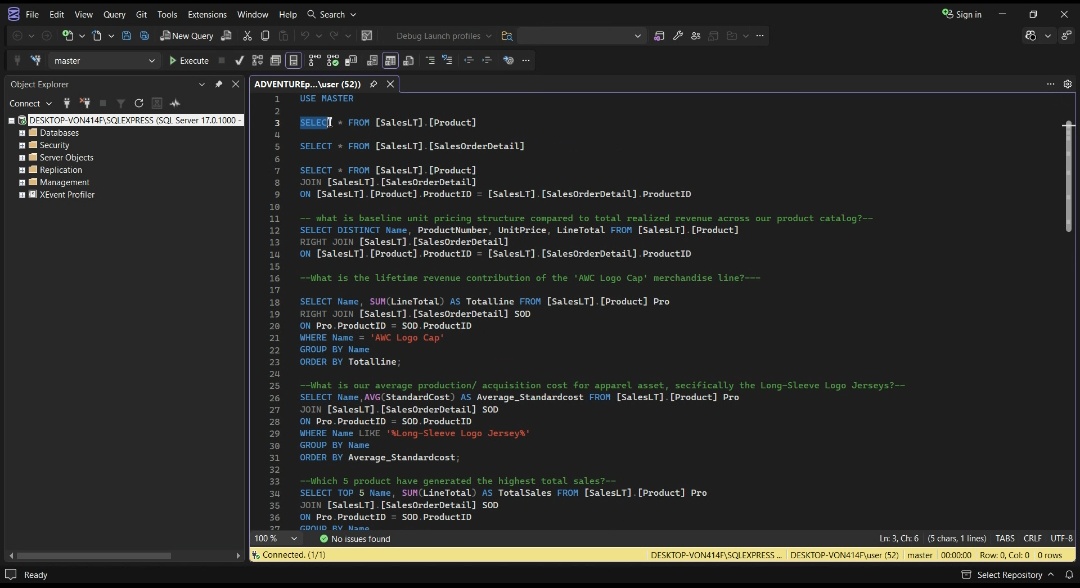
Designed and executed a comprehensive exploratory data analysis (EDA) framework using T-SQL in Microsoft SQL Server to extract business performance indicators from a high-volume retail transactions database.
Key Contributions:
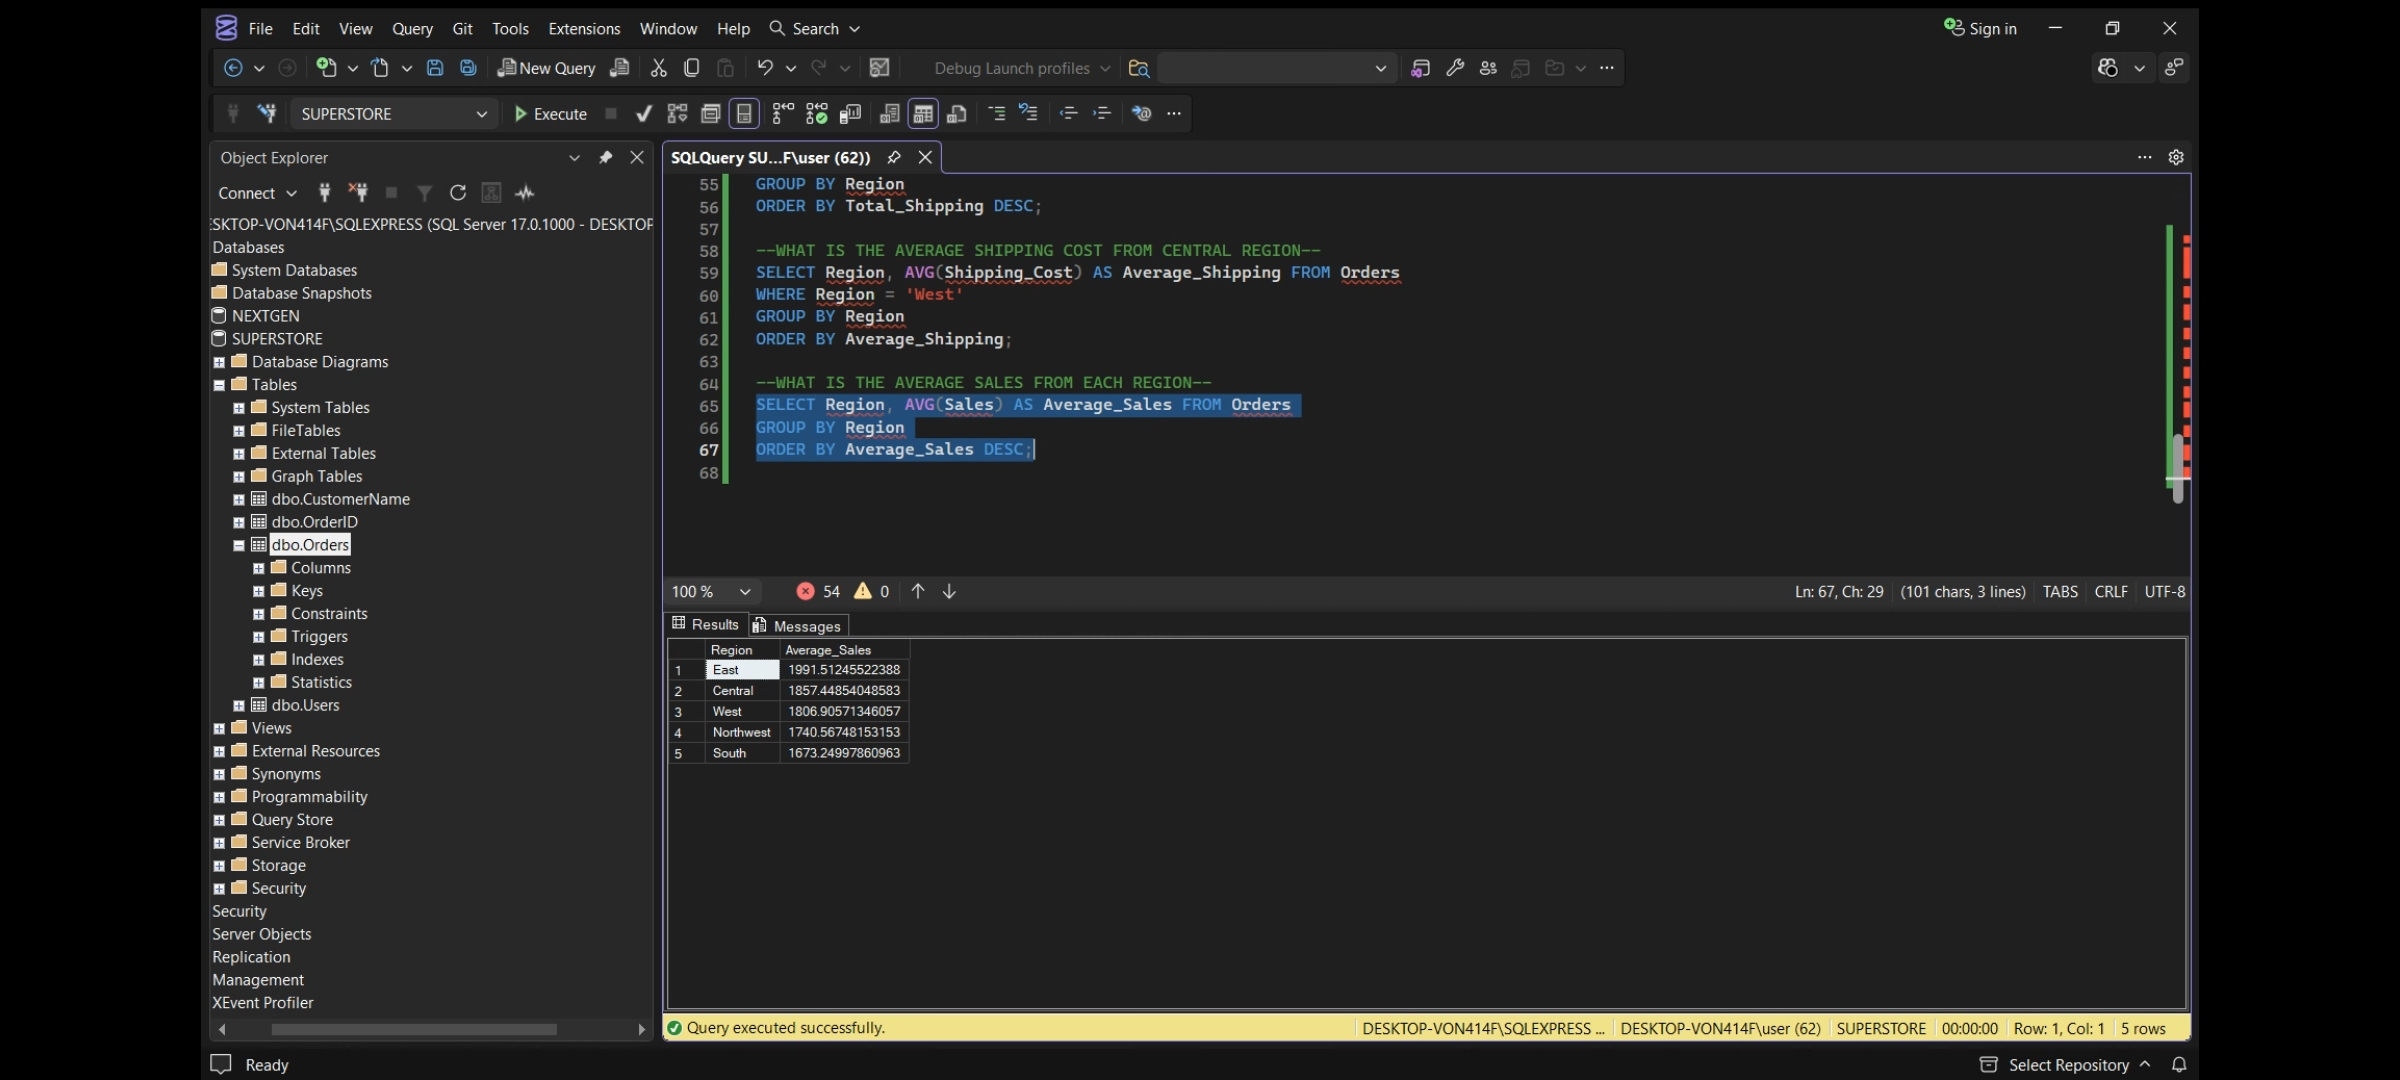
Advanced Aggregations & Grouping: Developed optimized queries utilizing multi-level GROUP BY clauses, window logic components (TOP 1), and aggregate metrics (SUM, COUNT DISTINCT, AVG) to parse transactional distributions across segments.
Performance Filtering: Built regional and segment-specific filters to isolate target operational hubs (e.g., analyzing shipping overheads within the Central and East corridors).
Business Intelligence Translation: Successfully translated unstructured stakeholder questions regarding revenue peaks, customer density, and logistics bottlenecks into structured data tables, preparing clean relational outputs for future visualization pipelines.
Tech Stack: MS SQL Server, T-SQL, SSMS (SQL Server Management Studio)
Data Quality Optimization & Standardization Engine
→
Summary
Project Title: E-Commerce & Operations Data Standardization Project
The Objective: Transformed a highly inconsistent, unformatted corporate dataset into a clean, reliable, and production-ready data source for business reporting.
Tools Used: Microsoft Excel, Advanced Text Functions, Data Cleansing Filters.
Key Responsibilities & Implementation:
Data Type & Alpha-Numeric Correction: Identified and resolved critical data entry corruption errors where numbers were mixed with look-alike letters (e.g., converting corrupted text inputs like "5O" and "1S" back into true structural integers like 50 and 15), ensuring future lookup operations would not fail.
Categorical Normalization: Standardized fragmented categorical fields by auditing and correcting inconsistent naming conventions (e.g., consolidating variations like "F", "Fe", and "Femeale" into a single normalized "Female" attribute, and "M" or "maele" into "Male").
Structural Integrity: Cleaned the data canvas by identifying and removing redundant blank rows and structural anomalies, significantly improving dataset presentation and processing efficiency.
The Deliverable:
Delivered a 100% standardized, error-free data asset ready for executive reporting, eliminating data discrepancies and preventing downstream analysis errors.
About
I am a detail-oriented Data Analyst focused on transforming messy, fragmented raw data into clean, structured, and actionable business intelligence. With a strong foundation in data architecture, advanced spreadsheet optimization, and functional programming, I specialize in building data pipelines that drive operational efficiency. My approach to data centers on integrity and usability—ensuring datasets are normalized, lookups are structurally sound, and final interfaces are intuitive for business stakeholders. Whether automating repetitive data workflows or engineering multi-dimensional reporting dashboards, I bridge the gap between complex raw metrics and strategic decision-making. Core Technical Toolset: Data Manipulation & Reporting: Advanced Excel (Pivot Tables, Power Query, Data Modeling/Power Pivot, Slicers). Advanced Lookups & Logic: XLOOKUP, INDEX/MATCH, Array Frameworks, Custom Sorting. Programming & Scripting: Python (File Handling, Automation Scripts, Core Structural Logic),Microsoft SQL Server and T-SQL. Data Quality: Categorical Normalization, Error Diagnostics, Alpha-Numeric Data Cleansing. I am eager to bring my analytical mindset, passion for clean data architecture, and technical problem-solving skills to a forward-thinking data or business intelligence team.
Skills
Ingestion
Normalization
BI/Data Model Tools
Excel PowerPivot.
Data Visualization/Analytics Tools
Power BI.
Operating Systems
Windows 7, Windows 10, Windows Server 2010, Windows Server 2016, MAC, Android, IOS.
Microsoft Office Suite
MS Excel, Word, PowerPoint, Outlook.
Technology Management
Database Management, Communication Systems, IT Infrastructure.
Conducted in-depth research on "Strategic Entrepreneurship and Performance of Small and Medium-Scale Enterprises in Lagos State, Nigeria."
Lagos State University
Ojo Lagos, Lagos State, Nigeria
→
Bachelor of Science (BSc)Accounting
Certificates
Association of Accounting Technicians West Africa (AATWA)
Association of Accounting Technicians West Africa (AATWA)
Work
ISE-OLUWA TRANSPORT SYSTEM
|
Associate Accountant and Reconciliation Officer
Lagos, Lagos State, Nigeria
→
Summary
Supported financial operations and ensured data integrity as an Associate Accountant and Reconciliation Officer, contributing to budgeting, auditing, and daily accounting functions.
Highlights
Assisted in critical budgeting and forecasting activities, collecting and analyzing financial data to support accurate financial projections.
Supported internal and external financial audits by preparing comprehensive documentation and providing clear explanations, ensuring audit readiness and compliance.
Maintained meticulous financial records and processes, consistently meeting stringent audit requirements and industry standards.
Facilitated efficient month-end and year-end close processes, ensuring strict compliance with accounting standards and regulatory requirements.
Prepared detailed financial reports for various stakeholders, including management and auditors, enhancing transparency and decision-making.
Performed daily, monthly, and annual financial reconciliations across bank statements, general ledger, and A/P-A/R, maintaining financial accuracy.
Zion Expressions
|
Junior Accountant
Lagos, Lagos State, Nigeria
→
Summary
Supported core accounting functions, including daily transactions, reconciliations, and financial reporting, ensuring accuracy and compliance.
Highlights
Assisted with daily accounting operations, including accurate processing of accounts payable, accounts receivable, and general ledger entries.
Reconciled bank statements and maintained precise financial records, ensuring data accuracy and compliance.
Prepared and processed over 50 invoices, expense reports, and purchase orders monthly, ensuring timely financial transactions.
Contributed to the preparation of financial statements and reports, supporting timely and accurate financial reporting.
Supported efficient month-end and year-end close processes, ensuring adherence to financial deadlines.
Monitored and managed financial transactions, ensuring meticulous and accurate recording in compliance with accounting principles.